Apatite CL spectrum, 20 keV e- beam, Torpy et al. 2020
Loading...
Measurement details
| Description | CL spectrum of Apatite from the Tista River, Bangladesh |
| Reference | Torpy et al. 2020 Torpy, A., Wilson, N., MacRae, C., Pownceby, M., Biswas, P., Rahman, M., & Zaman, M. (2020). Deciphering the Complex Mineralogy of River Sand Deposits through Clustering and Quantification of Hyperspectral X-Ray Maps. Microscopy and Microanalysis, 26(4), 768–792 https://doi.org/10.1017/S143192762000135X |
| Date measured | 2018-05-07 |
| Material | Apatite [ Ca5(PO4)3(OH, F, Cl) ] |
| Analysis technique | Cathodoluminescence (CL) |
| Instrument | JEOL 8500F |
| Probe | 20 keV electron beam |
| Beam current | 69.95 nA |
| Probe diameter | 2 μm |
| Acquisition time | 2682.66 s |
| Channel count | 1024 |
| Wavelength range | 348.233 … 730.123 nm |
| Intensity range | -577 … 1.141×10⁷ counts |
| Integral | 3.6128×10⁹ counts |
| Related measurement | Apatite EDS spectrum, 20 keV e- beam, Torpy et al. 2020 (co-measured) |
Specimen details
Specimen image
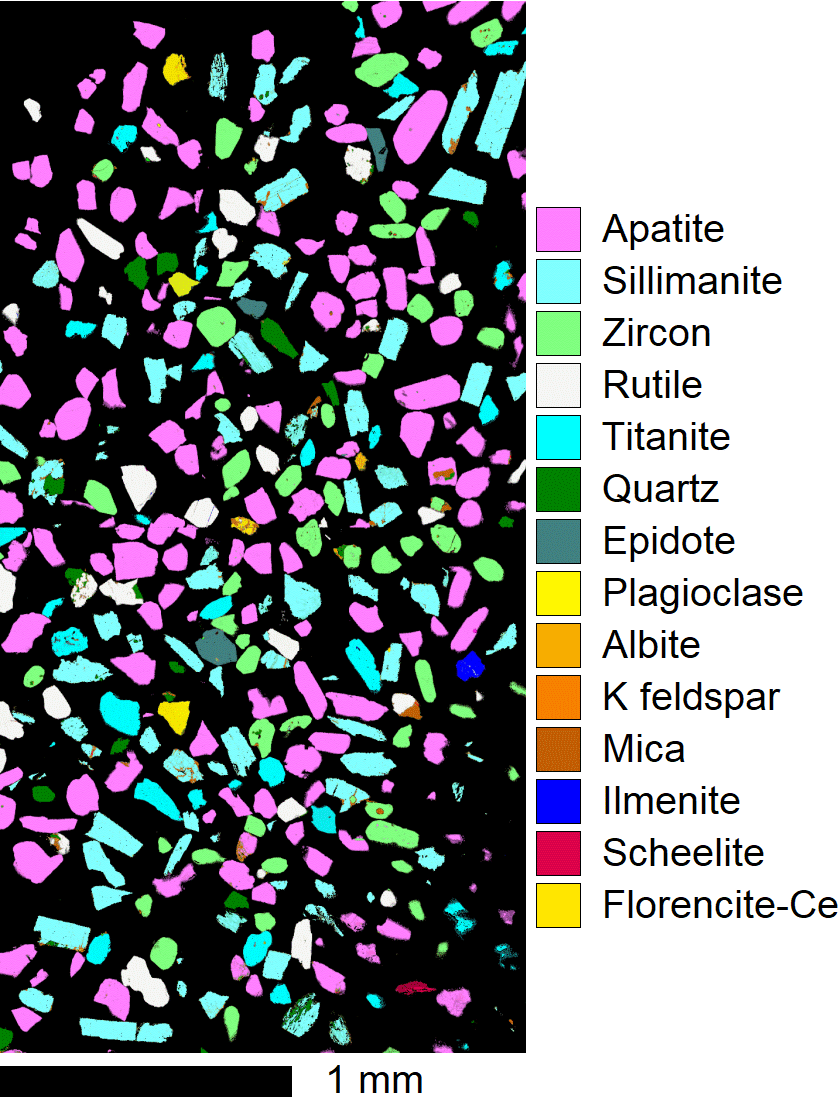
Image of a specimen of Zircon from Tista River, Bangladesh
(C) 2020 CSIRO Mineral Resources
Composition
| Element | At% | Wt% |
|---|---|---|
| H | 1.66 | 0.07 |
| Ca | 23.42 | 39.36 |
| P | 14.05 | 18.25 |
| O | 57.76 | 38.76 |
| F | 1.56 | 1.24 |
| Cl | 1.56 | 2.32 |
| Total | 100 | 100 |