Allanite-(Ce) EDS spectrum, 20 keV e- beam, Torpy et al. 2020
Loading...
Measurement details
| Description | EDS spectrum of Allanite-(Ce) |
| Reference | Torpy et al. 2020 Torpy, A., Wilson, N., MacRae, C., Pownceby, M., Biswas, P., Rahman, M., & Zaman, M. (2020). Deciphering the Complex Mineralogy of River Sand Deposits through Clustering and Quantification of Hyperspectral X-Ray Maps. Microscopy and Microanalysis, 26(4), 768–792 https://doi.org/10.1017/S143192762000135X |
| Date measured | 2018-05-01 |
| Material | Allanite-(Ce) [ CaCe(Al2FeII)[Si2O7][SiO4]O(OH) ] |
| Analysis technique | Energy dispersive x-ray spectrometry (EDS) |
| Instrument | JEOL 8500F |
| Probe | 20 keV electron beam |
| Beam current | 69.64 nA |
| Probe diameter | 2 μm |
| Detector name | 2× Bruker XFLASH |
| Det. technology | Silicon drift detector (SDD) |
| Real time | 104.359 s |
| Live time | 64.664 s |
| Dead time | 38.037 % |
| Channel count | 4096 |
| Energy range | -477.548 … 19984.5 eV |
| Gain | 4.99684 eV/channel |
| Intensity range | 2.056×10⁵ counts |
| Integral | 2.2225×10⁷ counts |
Specimen details
Specimen image
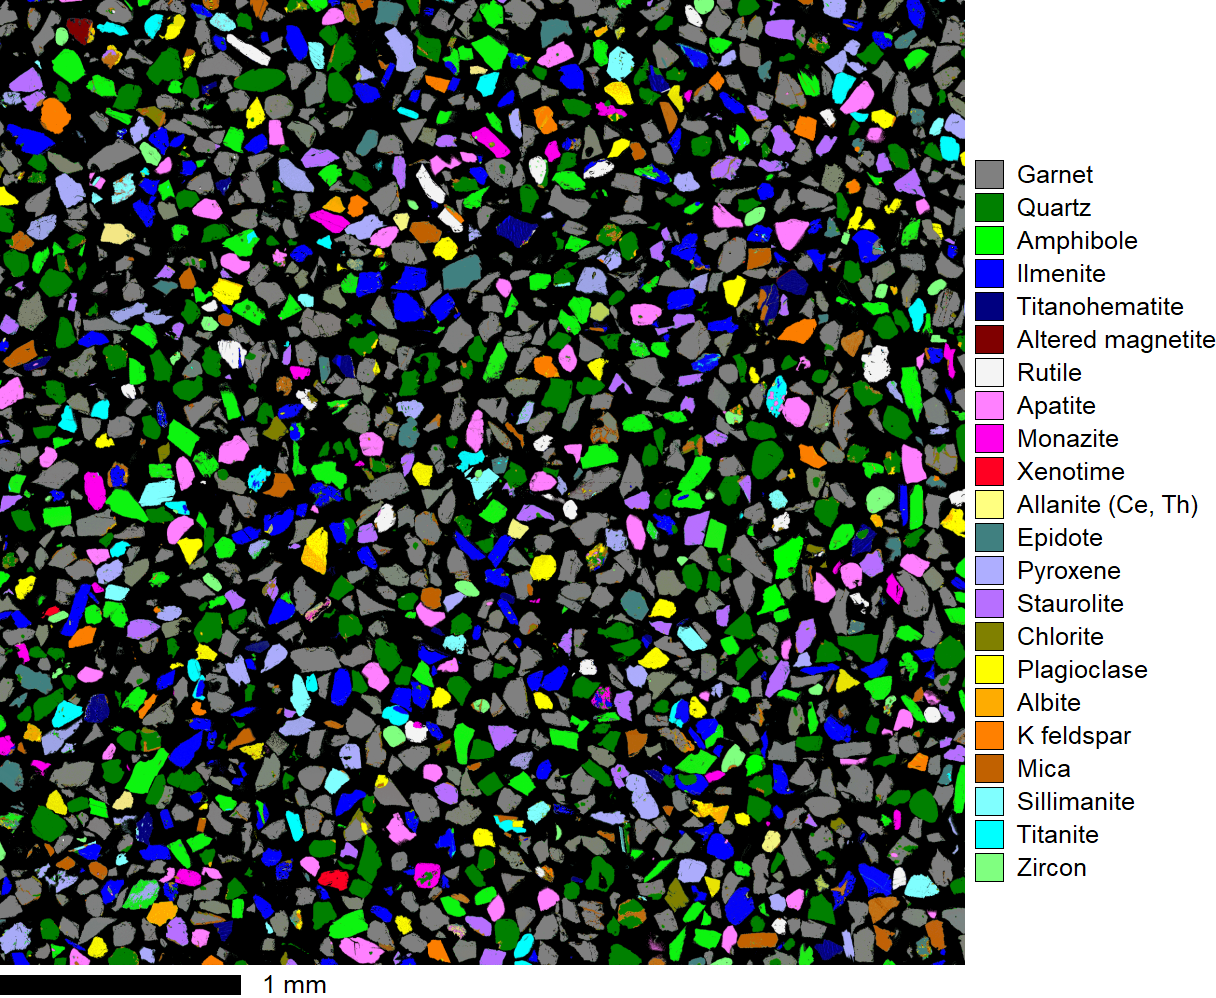
Clustered phase map of river sands (D4 shaker), from the Tista River, Bangladesh. From Torpy et al. 2020
(C) 2020 CSIRO Mineral Resources
Composition
| Element | At% | Wt% |
|---|---|---|
| Ca | 5.11 | 7.32 |
| Mg | 0.438 | 0.38 |
| Th | 0.14 | 1.16 |
| Gd | 0.0321 | 0.18 |
| Sm | 0.0223 | 0.12 |
| Nd | 0.666 | 3.43 |
| Ce | 1.63 | 8.18 |
| La | 0.798 | 3.96 |
| Y | 0.293 | 0.93 |
| Ti | 0.24 | 0.41 |
| Fe | 5.37 | 10.7 |
| Al | 8.76 | 8.44 |
| Si | 14.4 | 14.4 |
| O | 62.1 | 35.5 |
| Total | 100 | 95.11 |